Success story
Demystifying Global Oil Stocks Using Geospatial Intelligence

Intro
For many years, a dearth of reliable information regarding global oil inventories meant that oil traders and market analysts lacked the full picture when making trading decisions. In response, Geospatial Insight developed TankWatch to provide the market with precise, near real-time insight into above ground oil storage for any location worldwide, enabling better price risk management options and enhanced decision-making capabilities. The service is built upon on a satellite-based approach to deliver frequent and regular information reports across global oil storage tanks sites, providing a unique insight into global oil inventories and reserves, tailored to meet the needs of oil traders and analysts by combining very high-resolution satellite imagery with GSI’s proprietary analytics software.
Background project
Crude oil is the world’s most traded commodity by volume and value with up to 2.5 billion barrels traded daily. Knowledge of terrestrial crude storage is relatively well constrained in the USA where the Energy Information Authority reports weekly on current storage levels. However, in locations where terminal and refinery operators are not obliged to report their oil stocks, the situation is more opaque. This is particularly true for key oil producing and consuming regions such as China and the Middle East where “official” storage and capacity statistics are met with distrust by the market due to perceived inaccuracies in their reporting. Accordingly, to enable improved decision-making for traders and analysts, greater transparency is required regarding the crude fundamentals that play a significant role in determining the market price.
Issue and needs
The lack of reliable information coming out of many oil storage regions means that global oil stocks at any one time remain largely unknown. However, if this information were available, traders could gain competitive advantage by being better informed whilst businesses and end users could implement better risk management strategies regarding price fluctuations. As a result, there is strong demand for timely, quantitative objective intelligence for crude oil inventories for the many regions where official reporting is either unreliable or simply not performed.
Proposed solution
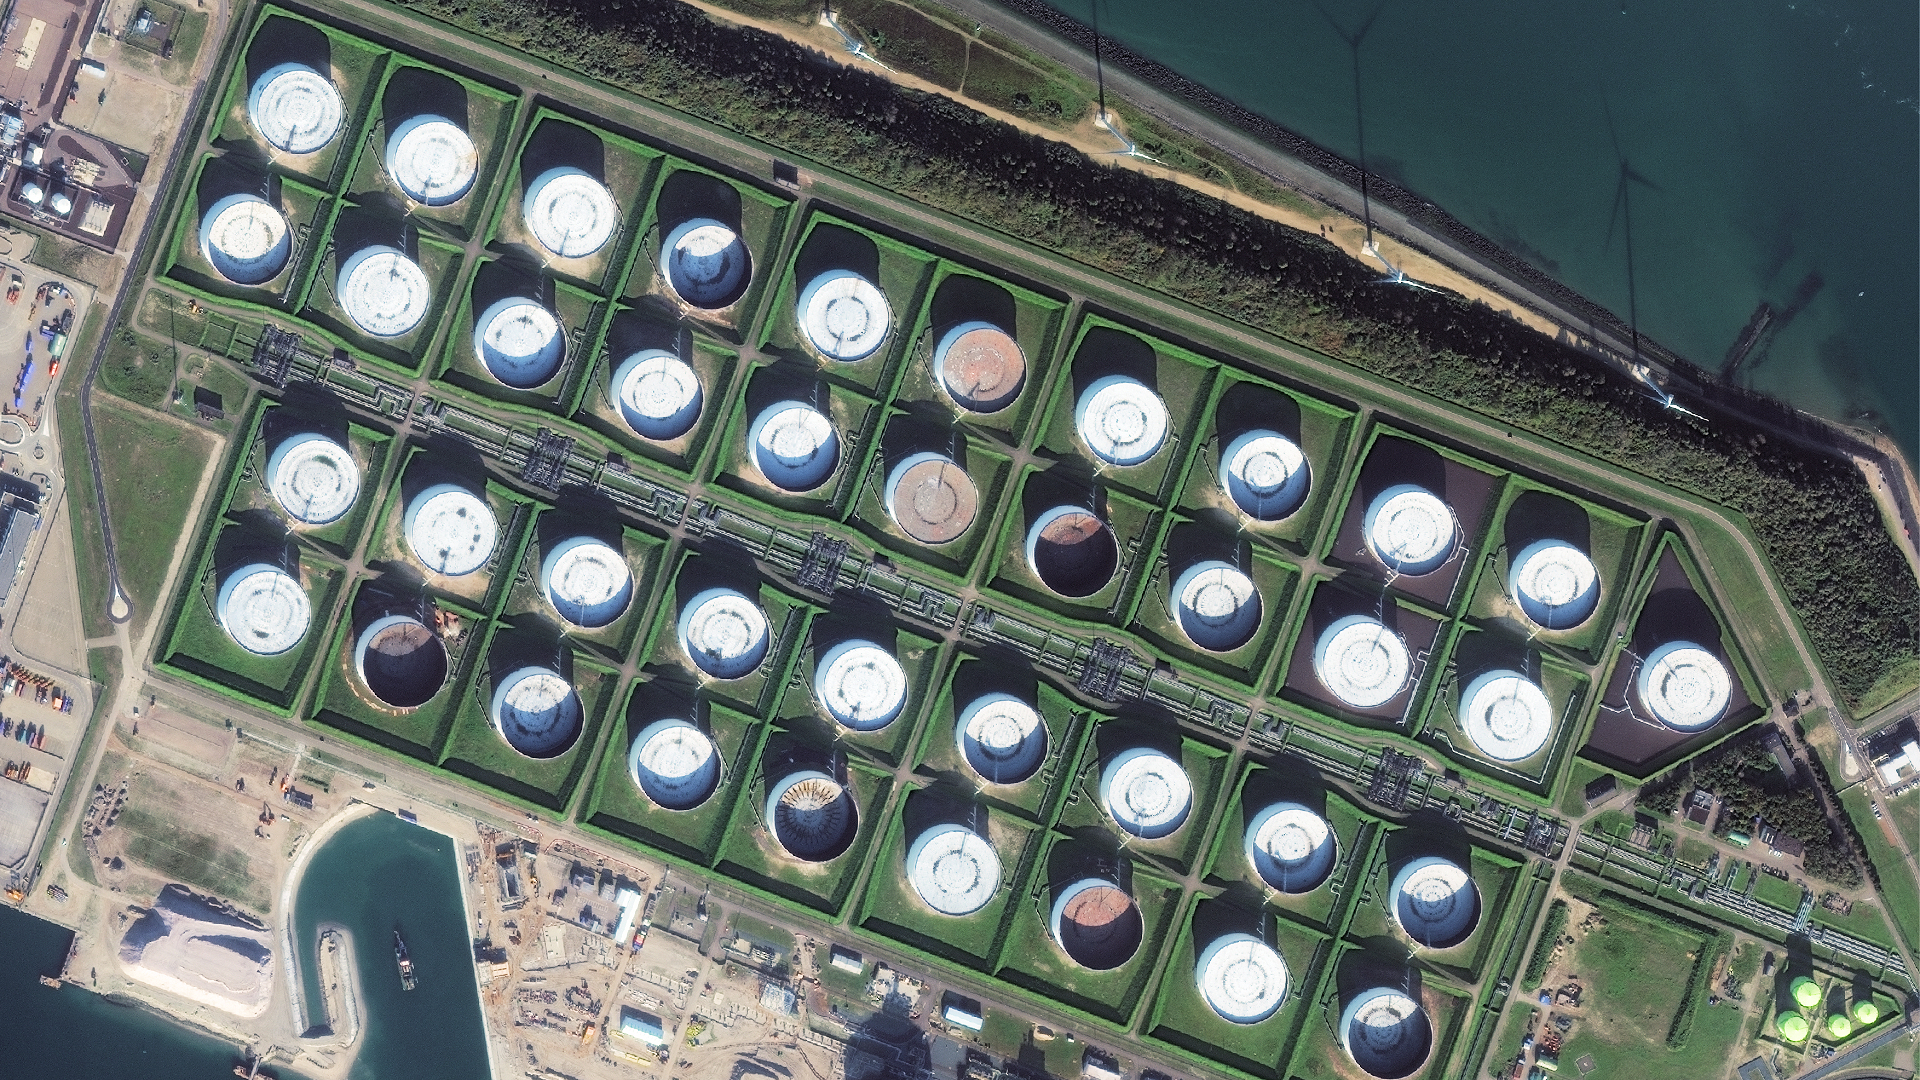
Geospatial Insight have developed TankWatch; an information product that uses proprietary software to measure and calculate the volumetric capacity and fill level of oil tanks with floating lids from satellite imagery. To generate tank capacity measurements, the software measures planar distances between tank features that automatically detected using spectral profiles from the processed ortho-image. These planimetric measurements are ingested into an algorithm that converts the distances into three-dimensional information by considering image meta-information such pixel resolution, image off-nadir capture angle and satellite azimuth at the time of acquisition. This approach can subsequently be used to measure the fill volumes by measuring the floating lid displacement for each tank. The semi-autonomous procedure allows for real-time QA of results and in measurement refinement by an experienced image analyst. Once the volumetric capacity has been determined for a tank, it is then suitable for fill volume estimation using Shadow Positioning Analysis. With this approach the algorithm automatically locates tank wall shadows that are cast across the floating lid and calculates the relative displacement of the shadow from its origin to determine the floating lid depression and corresponding fill estimate.
Industry perspective
Geospatial Insight are actively delivering clients with monthly, weekly and historical oil storage intelligence derived from submeter resolution satellite imagery for 69 key oil storage locations located across the world. Geospatial Insight’s TankWatch service has assisted key players in the oil and gas market by enabling them to de-risk their trading strategies through improved knowledge of crude inventories at many of the worlds key storage locations. TankWatch has continued to grow in capability with the addition of SAR analytics, enabling terminal measurement irrespective of cloud cover, which is the main challenge for optical remote sensing.


